Real-Time Container Monitoring and Alerts
Monitor your server, CPU, memory, and network usage in real-time across all your deployments for full visibility.
Ensure continuous operation with monitoring
Prevent disruption by setting up a monitoring dashboard and custom alerts.
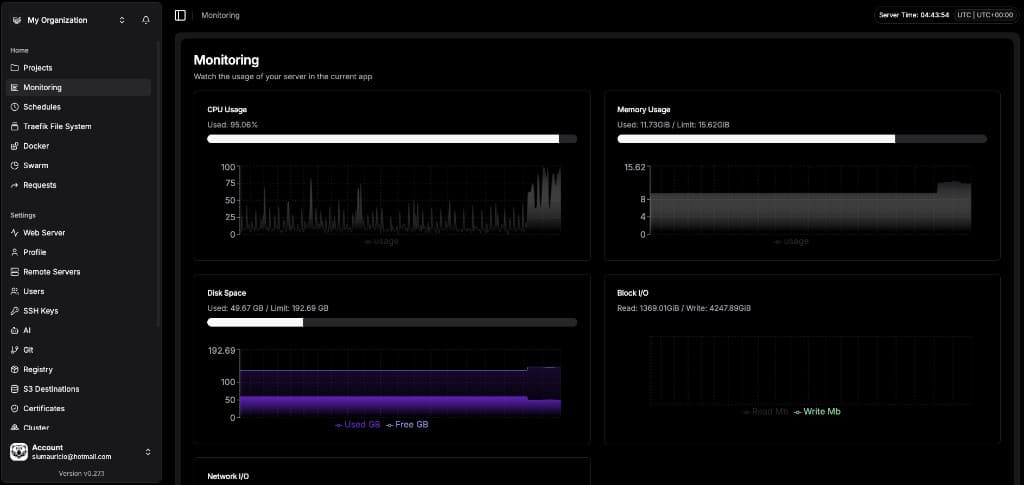
CPU monitoring
Spot CPU saturation early so you can scale, tune, or fix hot paths before performance drops.
Memory monitoring
Prevent out-of-memory crashes by watching RAM pressure and acting before the system starts killing processes.
Disk space monitoring
Avoid failed writes and broken deployments by recognizing low disk space before your used storage space hits 100%.
Network monitoring
Detect bandwidth congestion or unexpected traffic spikes early to prevent slowdowns and outages before they impact your services.
Configure alerts so you never miss an issue
Set thresholds, receive notifications where you work, and stay in control of your infrastructure at all times.
Threshold-based alerts
Set the CPU or memory usage percentage limit that you want to trigger an alert.
Notifications on your platforms
Receive notifications on the communication platforms you use.
Easy alert management
Disable alerts by just setting your limits to zero.
Access server monitoring with no setup required
Use Sagyboar's container monitoring dashboard as soon as you've completed the server deployment setup.
Remote servers → Select your server → Setup Server
If all your checkmarks are green, you're good to go!
Host Sagyboar where your business needs it
Choose a deployment option that suits your business—on your infrastructure or ours.
On-Premise Deployment
- Complete data sovereignty
- Maximum security control
- Compliance with strict regulations
- No external dependencies
Cloud Deployment
- Rapid scaling capabilities
- Reduced infrastructure overhead
- Global availability
- Managed infrastructure
Multiple configuration options
Set up your Sagyboar dashboard to suit your needs with different configuration options.
Set your refresh rates
Determine how frequently server and container metrics are collected—the default is every 20 seconds.
Manage how long data is stored
Decide on your retention period and an automated cron job will clean old metrics. Choose which port the Sagyboar metrics server listens on—the default is 4500.
Include or exclude specific services
Choose the services you want to monitor, whether that's all services, specific compose services, applications, or something else.
Secure your data with a token
Secure metrics access with an authentication token. Use the auto-generated metrics token or generate a new one.
Container and server monitoring FAQs
Container and Server monitoring tool
Take advantage of Sagyboar's comprehensive container and server monitoring software alongside the rest of the platform.
Ready to keep your systems running?
Get real-time visibility into your servers and containers with Sagyboar's built-in monitoring.